Debug config problems in Claude Code before they cost you hours. When hooks refuse to fire, permissions seem ignored, or MCP servers stay invisible, the cause almost always traces back to a file that didn’t load, a scope you forgot about, or a variable quietly overriding everything. This guide walks you through the full diagnostic toolkit, every environment variable that matters, and proven recipes to isolate and fix configuration issues fast.
Debug Config: What You’ll Learn
Every Claude Code session loads settings from up to six different sources, and that chain is where most debug config mysteries begin. You will learn how to inspect exactly what loaded, trace which scope wins for each setting, decode environment variables, and apply reliable debug config workflows that isolate even the strangest configuration bugs. By the end, you will have a repeatable process for any configuration surprise.
For a brief overview of these features, see our Advanced Features guide. This post is the comprehensive reference, going substantially deeper with full environment variable tables, debug flag references, and ready-to-use troubleshooting recipes.
The Diagnostic Command Suite
Claude Code ships with nine slash commands and several CLI flags built specifically for debug config work. Each one inspects a different layer of the configuration stack. Knowing which command answers which question is the single biggest speed boost you can give yourself during any debug config investigation.
The golden rule is simple: run the inspection command before guessing. Reading what Claude Code actually loaded almost always narrows the problem faster than re-reading your config files. The debug config commands below are listed in the order you typically reach for them during an investigation.
The /doctor Command
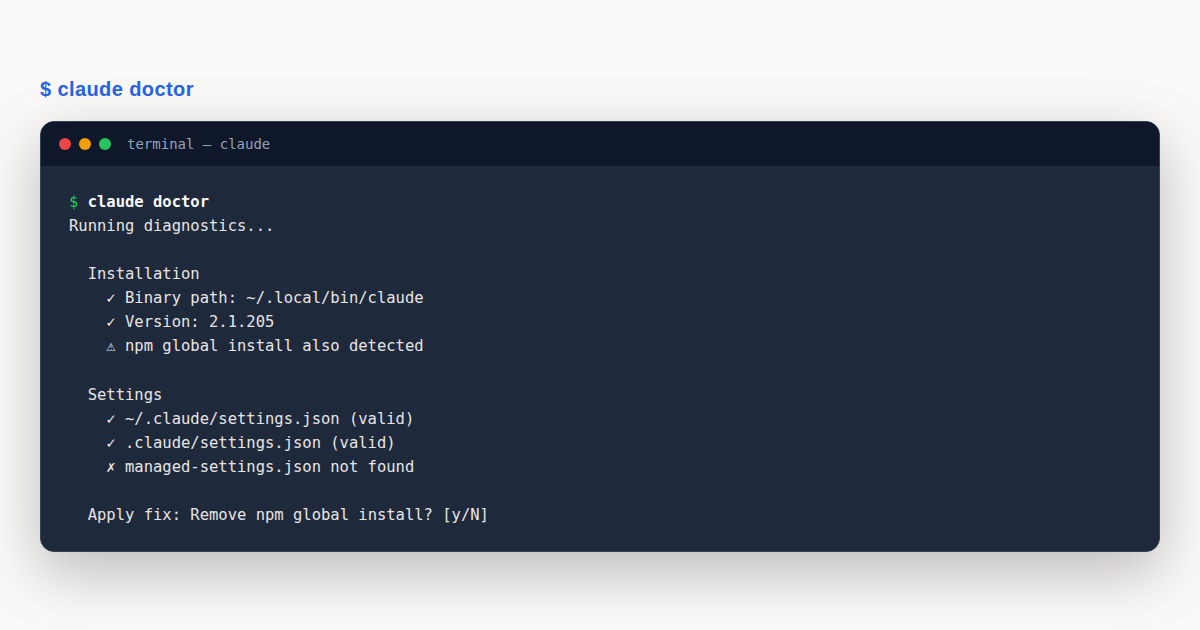
/doctor runs a full setup checkup covering installation health, invalid settings files, unused extensions, and duplicate subagent names in the same directory. It proposes fixes and applies them only after you confirm. Before certain versions, /doctor opened a read-only diagnostics screen and pressing f sent the report to Claude to fix.
From the terminal without starting a session, claude doctor prints read-only installation and settings diagnostics. This is invaluable for CI scripts and headless environments where you cannot open an interactive session. Make it your first stop for any debug config investigation that might involve a corrupt installation or malformed JSON.
The /context Command
/context shows everything occupying the context window for the current session, broken down by category: system prompt, memory files, skills, custom subagents with the source each loaded from, MCP tools, and conversation messages. Run it first to confirm whether your CLAUDE.md, rules, or skill descriptions are present at all.
If a memory file is missing from context, check its location against how CLAUDE.md files load. Subdirectory CLAUDE.md files load on demand when Claude reads a file in that directory with the Read tool, not at session start. This is one of the most common debug config surprises: a file that looks perfectly placed but never enters context because no Read tool call triggered its directory.
The /memory Command
/memory lists which CLAUDE.md and rules files loaded, plus auto-memory entries. If you edited a memory file and Claude still seems to follow old instructions, /memory tells you whether the new version actually loaded. A file that does not appear here simply is not in play.
If /memory confirms the file loaded but Claude still ignores a particular instruction, the issue is likely how the instruction is written, not whether it loaded. CLAUDE.md works well for project conventions, build commands, and where files belong. Adherence drops when an instruction is vague, when two files conflict, or when the file grows long enough that individual rules get less attention.
The /skills Command
/skills lists available skills from project, user, and plugin sources. If a skill does not appear here, the file structure is wrong. Skills must live in a folder with SKILL.md inside: .claude/skills/name/SKILL.md, not .claude/skills/name.md as a flat file.
If the skill appears in /skills but Claude never invokes it, check the badge for a “user-only” label. That means the skill has disable-model-invocation: true in its frontmatter, or its description doesn’t match how you phrase requests. Both are debug config issues you can fix by editing the skill’s frontmatter.
The /hooks Command
/hooks lists every hook registered for the current session, grouped by event. If a hook you defined does not appear, it isn’t being read. Hooks go under the "hooks" key in a settings file, never in a standalone file. Only plugins load a separate hooks/hooks.json.
Edits to settings.json take effect in the running session after a brief file-stability delay, so you don’t need to restart. If /hooks still shows the old definition a few seconds after saving, run /hooks again to refresh the view. To watch hook evaluation live, start with claude --debug hooks and trigger the tool call.
The /mcp Command
/mcp shows every configured server, its connection status, and whether you approved it for the current project. A server defined correctly can still fail to provide tools for several reasons worth checking during any debug config session involving MCP.
Project-scoped servers in .mcp.json require one-time approval. If the prompt was dismissed, the server stays disabled until you approve it from /mcp. A server that fails to start shows as failed. A connected server listing zero tools needs a Reconnect from /mcp, and if the count stays at zero, run claude --debug mcp to see stderr.
The /permissions Command
/permissions shows the resolved allow and deny rules currently in effect. This is your debug config lens for permission issues: it reveals the final merged result, not just what you wrote in one file. If a rule you added seems ignored, the resolved view shows whether a broader scope overrode it.
Remember that prefix rules match the literal command string, not the underlying executable. A Bash(rm *) deny rule does not block /bin/rm or find -delete. Add explicit patterns for each variant, or use a PreToolUse hook or the sandbox for a hard guarantee.
The /status Command
/status shows active settings sources, including whether managed settings are in effect. This is essential for enterprise debug config work where an admin-deployed managed settings file might be silently overriding everything you set locally. If a setting refuses to change no matter what you do, /status often reveals why.
Run /status alongside /doctor at the start of any complex investigation. Together they answer two questions: what is broken, and whose settings are winning right now. That pair of answers eliminates most wild goose chases.
The /debug Command
/debug [issue] enables debug logging for the session and prompts Claude to diagnose the issue using the log output and settings paths. It is the most interactive of the diagnostic commands because Claude itself reads the logs and proposes fixes based on what it finds.
Use /debug when you have already narrowed the problem with the other commands but need help interpreting what you see. It bridges the gap between raw log output and actionable insight, making it a powerful tool for debug config scenarios that resist obvious explanations.
CLI Debug Flags
Beyond slash commands, Claude Code offers several command-line flags that control debug output. These flags are essential for any thorough debug config investigation because they reveal what happens during startup, API calls, hook evaluation, and MCP initialization, all before the interactive session even begins. Mastering these flags is a core debug config skill.
The --debug Flag with Category Filtering
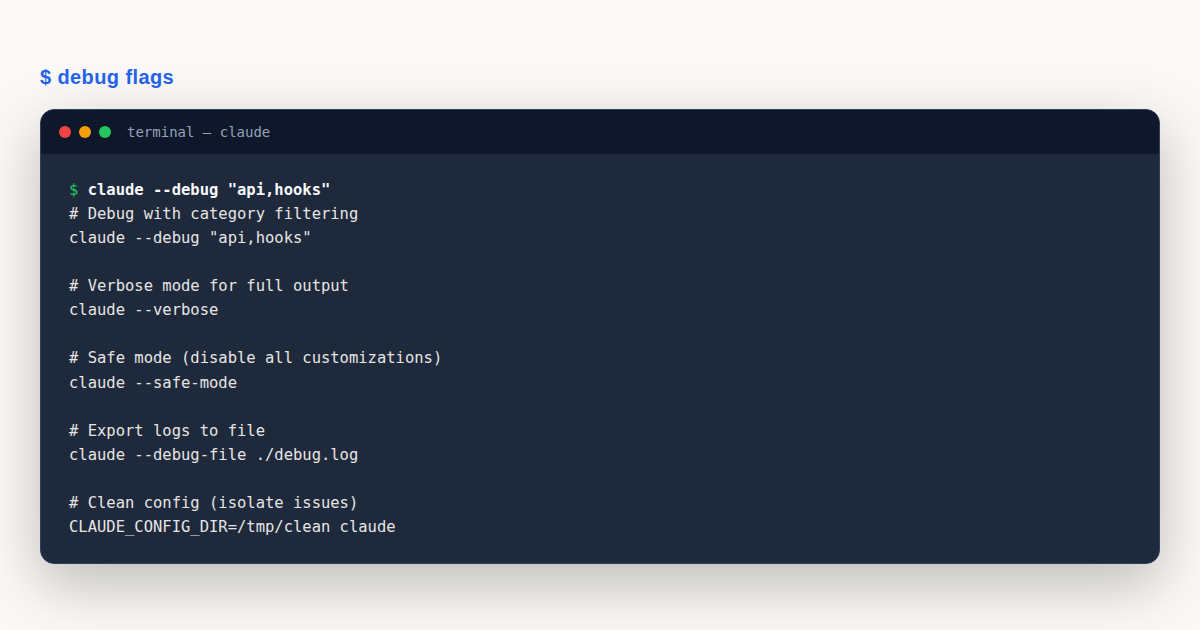
The --debug flag enables verbose debug logging. You can filter by category to focus on a specific subsystem, which is invaluable when you are drowning in log output during a complex debug config session. The syntax is claude --debug api,hooks to see only API and hook events.
claude --debug
claude --debug api
claude --debug hooks
claude --debug api,hooks,mcp
Common categories include api for request and response details, hooks for hook evaluation events, and mcp for MCP server communication. Combining categories with commas lets you trace interactions between subsystems without scrolling through unrelated noise.
The --debug-file Flag
The --debug-file flag writes debug output to a specified file instead of printing it to the terminal. This is perfect for debug config work in CI/CD pipelines or long sessions where you need to review the log afterward.
claude --debug api --debug-file /tmp/claude-debug.logWriting to a file keeps your terminal clean and gives you a searchable artifact. You can grep through it for specific error messages, timestamps, or category labels. In team environments, sharing the debug file helps colleagues reproduce and diagnose configuration issues remotely.
The --verbose Flag
--verbose increases output detail across the board. While --debug focuses on specific subsystem events, --verbose broadens the lens to include more general operational information. Use it when you need the full picture rather than a filtered view of one subsystem.
For most debug config work, you will alternate between --debug with targeted categories and --verbose for a broader sweep. Start broad with --verbose to identify which subsystem is likely at fault, then switch to --debug with the right category filter to zoom in.
The --safe-mode Flag
--safe-mode launches a session with all customizations disabled, including CLAUDE.md, skills, plugins, hooks, MCP servers, and custom commands and agents. Authentication, model selection, built-in tools, and permissions work normally. This is the nuclear option for debug config isolation.
claude --safe-modeIf the problem disappears in safe mode, one of those surfaces is the cause. Use the targeted commands like /hooks and /mcp to find which one. Safe mode still applies managed hooks and settings policy from your organization, so managed plugins, skills, CLAUDE.md, and MCP servers are turned off but managed settings remain active.
Settings Precedence and the Override Chain
Settings merge across managed, user, project, and local scopes. Understanding this precedence chain is the single most important concept for effective debug config work. When a setting doesn’t seem to apply, the value you set is usually being overridden by another scope or an environment variable. This debug config guide walks through every layer.
The full precedence order, from highest to lowest, is: managed settings (deployed by admins) override environment variables, which override CLI flags in some cases, which override local settings (settings.local.json), which override project settings (.claude/settings.json), which override user settings (~/.claude/settings.json).
Note that environment variables take precedence over settings file values. For example, ANTHROPIC_MODEL overrides the model setting. However, CLI flags like --model and in-session commands like /model override ANTHROPIC_MODEL. Each variable’s behavior varies, so check the reference table when a value seems stuck.
Run /status to see which settings sources are active for your current session, including whether managed settings are in effect. This one command often explains why a setting you changed locally has no visible effect: an admin-deployed managed settings file is silently winning at every scope below it.
The Two-Files Trap
One of the most frequent debug config mistakes involves confusing two files with similar names. ~/.claude.json and ~/.claude/settings.json are entirely different files with entirely different purposes, and putting configuration in the wrong one is a guaranteed way to spend hours wondering why nothing works. This debug config trap catches almost everyone eventually.
~/.claude.json holds app state and UI toggles. It does not read permissions, hooks, env, or any of the configuration keys you probably want to set. Those belong in ~/.claude/settings.json. The files live in different locations, have different schemas, and serve different roles.
// WRONG: permissions, hooks, env in ~/.claude.json
{
  "permissions": { "allow": ["Bash(npm test)"] },
  "hooks": { ... },
  "env": { "API_TIMEOUT_MS": "1200000" }
}

// CORRECT: same keys in ~/.claude/settings.json
{
  "permissions": { "allow": ["Bash(npm test)"] },
  "hooks": { ... },
  "env": { "API_TIMEOUT_MS": "1200000" }
}
If permissions, hooks, or environment variables set globally seem ignored, check whether they landed in ~/.claude.json by mistake. Move them to ~/.claude/settings.json and restart Claude Code. This single fix resolves a surprising percentage of all debug config reports.
A related variant: settings.local.json overrides settings.json within the same project. If a project-level setting seems ignored, check whether settings.local.json contains the same key with a different value. Both override the user-level file, but the local file always wins the project scope.
Environment Variables: API and Authentication
Claude Code reads dozens of environment variables that control API routing, authentication, model selection, and feature behavior. This section organizes the most important ones by category so you can find the right variable during any debug config investigation. Set these in your shell or under the env key in a settings file. This debug config reference covers them all.
Authentication variables control how Claude Code identifies itself to the API. Getting these wrong leads to cryptic 403 errors, unexpected billing, or requests that seem to work but route through the wrong account.
| Variable | Purpose |
|---|---|
ANTHROPIC_API_KEY | API key sent as X-Api-Key header. When set, overrides your subscription even if logged in. Run unset ANTHROPIC_API_KEY to use your subscription instead. |
ANTHROPIC_AUTH_TOKEN | Custom value for the Authorization header, prefixed with Bearer. Used for LLM gateway authentication. |
ANTHROPIC_BASE_URL | Override the API endpoint to route through a proxy or gateway. When set to a non-first-party host, MCP tool search is disabled by default. |
API_TIMEOUT_MS | Maximum time in milliseconds for API requests. Increase for slow proxies or complex operations that need more time. |
ANTHROPIC_CUSTOM_HEADERS | Custom headers in Name: Value format, newline-separated for multiple headers. Useful for gateway-specific requirements. |
ANTHROPIC_BETAS | Comma-separated list of additional anthropic-beta header values to opt into API betas before native support lands. |
For a practical debug config tip: if you are logged in with a subscription but Claude Code keeps using an API key instead, ANTHROPIC_API_KEY is probably set in your shell or settings file. Unset it and restart. In non-interactive mode (-p), the key is always used when present, which can cause surprising billing on CI runners.
Environment Variables: Model Selection
Model selection variables control which Claude model handles your requests. These are critical for debug config work because a wrong model can produce subtly degraded output that looks like a configuration problem but is actually a routing issue. Check these variables early in your debug config process.
| Variable | Purpose |
|---|---|
ANTHROPIC_MODEL | Override the primary model. The --model flag and /model command override this variable, which itself overrides the model setting. |
ANTHROPIC_DEFAULT_SONNET_MODEL | Model ID used when the Sonnet alias is selected. Override to point at a gateway-specific or fine-tuned variant. |
ANTHROPIC_DEFAULT_OPUS_MODEL | Model ID used when the Opus alias is selected. |
ANTHROPIC_DEFAULT_HAIKU_MODEL | Model ID used when the Haiku alias is selected. |
MAX_THINKING_TOKENS | Control the thinking budget. Higher values allow deeper reasoning at the cost of latency and token usage. |
CLAUDE_CODE_EFFORT_LEVEL | Override the effort level. This variable overrides the /effort command, giving you persistent control across sessions. |
ANTHROPIC_CUSTOM_MODEL_OPTION | Add a custom entry to the /model picker for non-standard or gateway-specific models. |
During a debug config session, if Claude’s responses suddenly seem weaker or faster than expected, check whether an environment variable is silently routing requests to a different model. ANTHROPIC_MODEL set in a CI environment is a common culprit when local and pipeline behavior diverge.
Environment Variables: Bash, MCP, Context, and Features
Several more variable groups round out the debug config reference. Bash variables control tool execution limits, MCP variables affect server communication, context variables manage compaction behavior, and feature flags toggle optional capabilities on or off. These debug config variables are essential for advanced tuning.
Bash Configuration Variables
| Variable | Purpose |
|---|---|
BASH_DEFAULT_TIMEOUT_MS | Default timeout for Bash tool commands in milliseconds. Increase for builds or test suites that run long. |
BASH_MAX_OUTPUT_LENGTH | Maximum characters of output retained from a single Bash command. Increase for verbose build logs. |
MCP Configuration Variables
| Variable | Purpose |
|---|---|
MCP_TIMEOUT | Timeout for MCP server startup in milliseconds. Increase for servers that initialize slowly or load large schemas. |
MAX_MCP_OUTPUT_TOKENS | Maximum tokens returned by a single MCP tool call. Tune to balance detail against context window pressure. |
ENABLE_TOOL_SEARCH | Re-enable MCP tool search when using a non-first-party ANTHROPIC_BASE_URL that forwards tool_reference blocks. |
Context and Compaction Variables
| Variable | Purpose |
|---|---|
DISABLE_COMPACT | Disable automatic context compaction entirely. Useful for debug config sessions where you need the full conversation preserved. |
CLAUDE_AUTOCOMPACT_PCT_OVERRIDE | Override the context window percentage that triggers auto-compaction. Set higher to delay compaction or lower to trigger it sooner. |
Feature Flag Variables
| Variable | Purpose |
|---|---|
DISABLE_PROMPT_CACHING | Turn off prompt caching. Increases costs and latency but can help isolate caching-related issues during debug config work. |
DISABLE_TELEMETRY | Disable telemetry collection entirely. Set this in CI environments or when corporate policy prohibits usage reporting. |
CLAUDE_CODE_DISABLE_AUTO_MEMORY | Turn off the automatic memory feature that saves learnings between sessions. Useful when memory entries cause unexpected behavior. |
CLAUDE_CODE_AUTO_CONNECT_IDE | Override the autoConnectIde setting. Set to false to prevent automatic IDE detection at startup. |
A key debug config principle: variables in the env key of settings.json do not propagate to MCP child processes. If an MCP server needs specific environment variables, set them per-server inside .mcp.json instead. This separation catches many developers off guard.
Network, Proxy, and TLS Configuration
Enterprise environments introduce proxy servers, corporate firewalls, certificate inspection, and mutual TLS requirements. Claude Code supports all of these through a specific set of environment variables. Getting these right is essential for debug config work behind corporate networks, and this section covers the full enterprise debug config toolkit.
| Variable | Purpose |
|---|---|
HTTPS_PROXY | Route API requests through an HTTPS proxy. Essential behind corporate firewalls. Format: http://proxy.example.com:8080 |
HTTP_PROXY | Route HTTP requests through a proxy. Set alongside HTTPS_PROXY for consistent behavior. |
NODE_EXTRA_CA_CERTS | Path to additional CA certificates. Set this when corporate proxies perform TLS inspection, causing unable to get local issuer certificate errors. |
CLAUDE_CODE_CLIENT_CERT | Path to a client certificate for mutual TLS (mTLS) authentication. Required by some enterprise API gateways. |
CLAUDE_CODE_GIT_BASH_PATH | Explicit path to Git Bash on Windows. Set when Claude Code cannot find bash.exe automatically. |
CLAUDE_CONFIG_DIR | Override the configuration directory. Point at an empty directory to test against a clean configuration during debug config isolation. |
For corporate TLS inspection, the most common debug config fix is combining NODE_EXTRA_CA_CERTS with your IT team’s CA bundle. Ask your IT department for the certificate file if you don’t have it, then set the variable before launching Claude Code.
export NODE_EXTRA_CA_CERTS=/path/to/corporate-ca.pem
export HTTPS_PROXY=http://proxy.example.com:8080
claude
For mTLS scenarios where the API gateway requires a client certificate, set CLAUDE_CODE_CLIENT_CERT to the PEM file path. Some gateways also need a client key, so check your gateway’s documentation for the full requirements.
Common Installation Errors
Before diving into configuration-specific debug config work, rule out installation issues. Many problems that look like configuration failures are actually broken installs, missing PATH entries, or binary incompatibilities. The table below maps the most common symptoms to their fixes and is a key part of your debug config toolkit.
| Symptom | Cause and Fix |
|---|---|
command not found: claude | Install directory not in PATH. Add ~/.local/bin to your shell’s PATH variable, restart the terminal, verify with claude --version. |
syntax error near unexpected token | Install URL returned HTML, not the script. Use an alternative installer like Homebrew or WinGet, or retry after a few minutes. |
Killed or exit code 137 | OOM killer terminated the install. Add swap space with fallocate, close memory-heavy processes, or use a larger instance. |
TLS connect error | CA certificates missing or corporate proxy performing TLS inspection. Update CA certs or set NODE_EXTRA_CA_CERTS to your corporate bundle. |
Failed to fetch version | Cannot reach downloads.claude.ai. Set HTTPS_PROXY for corporate networks or try a different network. |
App unavailable in region | Claude Code is not available in your country. Check the supported countries list on Anthropic’s website. |
Illegal instruction | CPU lacks AVX instruction set or wrong architecture binary downloaded. Check uname -m output and verify CPU support. |
Error loading shared library | Wrong binary variant (musl vs glibc). Run ldd --version to check which libc your system uses and reinstall the correct variant. |
For a deeper debug config approach to installation issues, check for conflicting installations with which -a claude on macOS or Linux. Multiple binaries in different directories cause version mismatches and unpredictable behavior. Keep only the native installer at ~/.local/bin/claude and remove legacy copies.
Common Configuration Errors
Once installation is ruled out, the next debug config frontier is configuration itself. The table below covers the most frequent configuration mistakes, their symptoms, and precise fixes. These are the issues that /doctor, /hooks, and /mcp are designed to surface during debug config sessions.
| Symptom | Cause and Fix |
|---|---|
| Hook never fires | matcher is a JSON array instead of a string. Use a single string with | separator, like "Edit|Write". |
| Hook never fires | matcher uses lowercase tool names. Matching is case-sensitive. Tool names are capitalized: Bash, Edit, Write, Read. |
| Hook never fires | Hooks defined in a standalone file. There is no standalone hooks file. Define hooks under the "hooks" key in settings.json. |
| Permissions ignored globally | Configuration added to ~/.claude.json instead of ~/.claude/settings.json. These are two different files with different purposes. |
| Setting seems ignored | Same key exists in settings.local.json. Local overrides project, which overrides user. Check every scope. |
| MCP servers never load | .mcp.json placed inside .claude/ directory. Project MCP config goes at the repository root, not in .claude/. |
| MCP servers in settings ignored | settings.json does not read an mcpServers key. Define project servers in .mcp.json or use claude mcp add --scope user. |
| MCP server fails from some directories | command or args uses a relative path. Use absolute paths for local scripts. PATH executables like npx work as-is. |
Skill missing from /skills | Skill file placed as a flat markdown file. Use a folder with SKILL.md inside: .claude/skills/name/SKILL.md. |
| Subdirectory CLAUDE.md ignored | Subdirectory files load on demand, not at session start. They load when Claude reads a file in that directory with the Read tool. |
| MCP server missing env variables | Variables in settings.json env don’t propagate to MCP child processes. Set per-server env inside .mcp.json instead. |
Debugging Workflow Recipes
The best debug config investigators don’t guess, they follow proven recipes. These twelve workflows cover the most common scenarios. Each one narrows the problem systematically until the root cause becomes obvious. Keep these debug config recipes handy for your next investigation.
Recipe 1: Safe Mode Isolation
Start with claude --safe-mode to disable all customizations. If the problem disappears, you know the cause lives in your CLAUDE.md, skills, plugins, hooks, MCP servers, or custom commands. Reintroduce them one at a time to find which.
claude --safe-modeRecipe 2: Clean Config Directory
Point CLAUDE_CONFIG_DIR at an empty directory and launch from a folder with no .claude directory, .mcp.json, or CLAUDE.md. This bypasses everything under ~/.claude for a truly clean slate.
cd /tmp && CLAUDE_CONFIG_DIR=/tmp/claude-clean claudeNote that managed settings still apply if your organization deploys them. On Linux and Windows, you will be prompted to log in again because credentials live under the config directory. On macOS, credentials are in the Keychain and carry over.
Recipe 3: CI/CD Minimal Mode
For CI pipelines, disable everything that adds startup time or unpredictability. Set DISABLE_TELEMETRY, CLAUDE_CODE_DISABLE_AUTO_MEMORY, and use -p for non-interactive mode. This gives you a deterministic debug config baseline for automated testing.
DISABLE_TELEMETRY=true
CLAUDE_CODE_DISABLE_AUTO_MEMORY=true
claude -p "Run the test suite and report results"
Recipe 4: Bedrock Streaming Fix
When using Amazon Bedrock, streaming responses can fail or truncate. This is a known debug config scenario related to how Bedrock handles streaming compared to the first-party API. Check that CLAUDE_CODE_USE_BEDROCK is set correctly and that your AWS credentials have the right permissions.
Recipe 5: Hook Matcher Debugging
If a hook appears in /hooks but never fires, watch hook evaluation live. Start a session with claude --debug hooks and trigger the tool call. The debug log records each event, which matchers were checked, and the hook’s exit code and output.
claude --debug hooksRecipe 6: MCP Server Diagnostics
When an MCP server connects but returns zero tools, select Reconnect from /mcp. If the count stays at zero, run claude --debug mcp to see the server’s stderr output. This reveals startup errors that the normal connection view hides.
Recipe 7: Settings Precedence Audit
Run /status to see which settings sources are active. Then run /doctor to check for invalid settings files. Compare the two outputs to identify whether managed settings, environment variables, or local overrides are winning over your project or user settings.
Recipe 8: Context Window Inspection
When Claude seems to ignore instructions, run /context to see what actually occupies the context window. If a memory file is missing, check whether it lives in a subdirectory that loads on demand rather than at session start.
Recipe 9: Model Routing Verification
If responses seem unexpectedly fast or shallow, check ANTHROPIC_MODEL and the ANTHROPIC_DEFAULT_* variables. An environment variable set in a CI pipeline or shell profile can silently route requests to a different model than you expect.
Recipe 10: Permission Override Detection
When permission rules seem ignored, run /permissions to see the resolved rules. Look for deny rules at higher-precedence scopes that override your allow rules. Remember that managed settings always win when present.
Recipe 11: Proxy and TLS Chain Verification
For corporate networks, verify the full chain: HTTPS_PROXY is set, NODE_EXTRA_CA_CERTS points to the corporate CA bundle, and ANTHROPIC_BASE_URL is configured if you route through a gateway. Test connectivity with curl -sI https://api.anthropic.com first.
Recipe 12: Debug File Capture for Support
When asking for help or filing an issue, capture a complete debug log. Use --debug with relevant categories and write to a file with --debug-file. Share the sanitized file so others can see exactly what happened during your session.
claude --debug api,hooks,mcp --debug-file /tmp/claude-session.logA Worked Example
Imagine you just added a PreToolUse hook that should block edits to files in a secrets/ directory. You saved the hook configuration, restarted Claude Code, and asked it to edit a file inside secrets/. The edit went through without any prompt. Your hook didn’t fire, and your debug config investigation begins.
You start the debug config investigation by running /hooks. The hook doesn’t appear in the list at all. This tells you the configuration file isn’t being read, not that the matcher is wrong. You check where you defined the hook and discover it lives in ~/.claude.json instead of ~/.claude/settings.json. That is the two-files trap in action.
You move the hooks configuration from ~/.claude.json to ~/.claude/settings.json, save the file, and wait a few seconds. Running /hooks again now shows your PreToolUse hook in the list. You try the edit again, and this time Claude prompts you as expected. The hook fires.
Now you want to verify the matcher works for multiple tools. You update the matcher to "Edit|Write" so it covers both edit and write operations. You run claude --debug hooks to watch the evaluation live. The debug log shows each event, the matchers checked, and the exit code. Everything works.
This scenario illustrates the core debug config workflow: inspect with a slash command, identify the gap between what you expected and what loaded, check the file location and format, fix, and verify. Most configuration problems yield to this same five-step pattern. The key is trusting the inspection commands over your assumptions about what should be happening.
Now suppose a colleague reports the same hook isn’t firing for them. You ask them to run /hooks and /status. Their /status output shows managed settings are in effect. An admin-deployed managed settings file contains a hooks key that overrides the user-level settings. Your colleague needs to ask the admin to add the hook to the managed settings file, because no amount of local editing will override managed settings. This is why /status is so valuable for enterprise debug config work.
Debug Config: Common Mistakes to Avoid
Even experienced developers fall into the same debug config traps repeatedly. Recognizing these patterns saves hours of frustration and helps you avoid problems before they start. Review this debug config checklist before your next session.
- Editing the wrong file. Putting permissions, hooks, or env configuration in
~/.claude.jsoninstead of~/.claude/settings.json. These are two different files. Always verify you are editing the settings file, not the app-state file. - Forgetting the local override.
settings.local.jsonoverridessettings.json. If a project-level setting seems stuck, check whether a local file is winning. This is especially easy to miss because local files are often gitignored. - Missing the approval prompt. Project-scoped MCP servers in
.mcp.jsonrequire one-time approval. If you dismissed the prompt, the server stays disabled until you approve it from/mcp. Always check the approval status. - Using relative paths for MCP. MCP server commands with relative file paths resolve against the directory you launched Claude Code from, not the location of
.mcp.json. Always use absolute paths for local scripts to avoid directory-dependent failures. - Assuming subdirectory CLAUDE.md loads at startup. Subdirectory memory files load on demand when Claude reads a file in that directory with the Read tool. They do not load at session start. This is one of the most misunderstood behaviors in the entire system.
- Using commas in hook matchers on old versions. Before certain versions, a comma in the matcher field fell through to regex evaluation and matched nothing. Use the
|separator to be safe across all versions. - Ignoring managed settings. In enterprise environments, managed settings deployed by admins override everything below them. No amount of local or project configuration will change a managed value. Always check
/statusfirst.
Settings Files and Their Locations
To round out your debug config reference, here is the complete map of every configuration file, where it lives, and what it controls. Keep this debug config reference section bookmarked for quick lookup when a setting behaves unexpectedly.
| File | Scope and Purpose |
|---|---|
~/.claude/settings.json | User settings. Applies to you in every project. This is where global permissions, hooks, and env vars belong. |
.claude/settings.json | Project settings. Applies to everyone working in the project. Checked into source control. |
.claude/settings.local.json | Local project settings. Applies to you in this project only. Gitignored. Overrides project settings. |
| Managed settings | Organization-wide settings deployed by an admin. Lives at a system path. Always wins when present. |
~/.claude.json | App state and UI toggles only. Does NOT hold permissions, hooks, or env vars. Common debug config trap. |
.mcp.json | Project MCP server configuration. Lives at the repository root, not inside .claude/. |
CLAUDE.md | Memory file with project conventions. Root-level loads at startup. Subdirectory files load on demand. |
.claude/skills/name/SKILL.md | Custom skill definitions. Must be in a folder, not a flat file. Listed by /skills. |
For the full .claude directory reference, every config file location, and what reads it, see the official Claude Code documentation. Bookmark that page alongside this guide for your next debug config session.
The Precedence Chain in Detail
Understanding exactly how scopes interact is the most important conceptual tool for debug config mastery. The chain works like a layered filter. Each scope can set, override, or supplement keys from broader scopes. When two scopes set the same key, the narrower scope wins. This is the heart of effective debug config reasoning.
Managed settings always win when present. Among the rest, the order from highest to lowest is: environment variables, then local project settings, then project settings, then user settings. CLI flags and in-session commands add yet another override layer that interacts with specific keys in feature-specific ways.
For example, the model setting in settings.json is overridden by the ANTHROPIC_MODEL environment variable, which is itself overridden by the --model CLI flag, which is overridden by the /model in-session command. This layered override chain lets you set a sensible default, override it per-project, override that per-session, and override that per-invocation.
The practical debug config takeaway: when a setting won’t change, walk up the chain. Start with /status to see if managed settings are active. Check your environment variables with env | grep ANTHROPIC. Review settings.local.json for local overrides. Then check project and user settings in order. The winning value is the first one you find at the highest precedence scope.
Debug Config: Best Practices
- Run inspection commands before guessing. Always use
/doctor,/status,/hooks, or/mcpbefore theorizing about what might be wrong. The commands tell you exactly what loaded, which narrows the problem immediately. - Keep one installation method. Multiple Claude Code installations cause version mismatches and unpredictable behavior. Use the native installer at
~/.local/bin/claudeand remove all legacy copies to keep your debug config baseline clean. - Use absolute paths in MCP config. Relative paths in MCP server commands resolve against the launch directory, not the config file location. Always use absolute paths for local scripts to avoid directory-dependent failures.
- Set per-server env in .mcp.json. Environment variables in
settings.jsonenvdon’t propagate to MCP child processes. Set per-serverenvinside.mcp.jsonfor each server that needs specific variables. - Document your settings chain. In team environments, maintain a README or wiki page documenting which settings are managed, which are project-wide, and which are local. This reduces debug config confusion when onboarding new developers.
- Capture debug logs for reproducible issues. Use
--debugwith category filters and--debug-fileto create searchable artifacts. Share sanitized logs when asking for help so others can see exactly what happened. - Test in safe mode first. When a problem appears, start with
claude --safe-modeto quickly determine whether the cause is in your customizations or in Claude Code itself. This one step saves hours of misdirected effort. - Check managed settings in enterprise environments. Always run
/statusbefore debugging a setting that refuses to change. Managed settings silently override everything below them, and no local edit will fix that.
Debug Config: Frequently Asked Questions
What is the fastest way to debug config problems in Claude Code?
Run /doctor for a full checkup and /status to see which settings sources are active. Together they answer what is broken and whose settings are winning. Follow up with /hooks, /mcp, or /context for targeted inspection.
Why are my hooks not firing even though the config looks correct?
The most common debug config cause is putting hooks in the wrong file. Hooks belong under the "hooks" key in settings.json, never in ~/.claude.json or a standalone file. Run /hooks to verify they loaded, then check the matcher syntax.
How do I test Claude Code with a completely clean configuration?
Point CLAUDE_CONFIG_DIR at an empty directory and launch from a folder with no .claude directory, .mcp.json, or CLAUDE.md. This bypasses all user and project configuration. Managed settings still apply if your organization deploys them.
What environment variables control model selection for debug config work?
ANTHROPIC_MODEL sets the primary model. ANTHROPIC_DEFAULT_SONNET_MODEL, ANTHROPIC_DEFAULT_OPUS_MODEL, and ANTHROPIC_DEFAULT_HAIKU_MODEL control each alias. The --model flag and /model command override these variables.
How do I fix TLS errors behind a corporate proxy during debug config work?
Set NODE_EXTRA_CA_CERTS to your corporate CA bundle path and HTTPS_PROXY to your proxy URL. Ask your IT team for the certificate file. If TLS inspection causes unable to get local issuer certificate errors, the CA bundle is the fix.
Debug config mastery comes down to three habits: inspect before you guess, understand the precedence chain, and use clean-slate isolation when stuck. Run the diagnostic commands to see what actually loaded, trace overrides from managed settings down to local files, and test against a clean configuration directory to separate your setup from Claude Code itself. Every configuration surprise yields to this process.
Continue Learning
Enterprise Integration and Production System Architecture
Deploying large language models into enterprise production environments requires strict adherence to modular software engineering principles. A resilient system architecture decouples user-facing API gateways from back-end inference worker pools, ensuring asynchronous execution and effective load balancing during peak traffic spikes.
Furthermore, maintaining high system availability mandates implementing robust retry logic, exponential backoff strategies, and automated circuit breakers across all integration endpoints. When downstream inference nodes experience transient latency or rate-limiting events, fallback pathways preserve operational continuity without degrading the core user experience.
Data Governance, Privacy, and Compliance Frameworks
Enterprise data governance models enforce rigid privacy boundaries around proprietary data assets. Implementing differential privacy mechanisms, localized data anonymization, and field-level encryption ensures sensitive information is protected throughout the model lifecycle. Compliance with global regulatory mandates such as GDPR, HIPAA, and SOC 2 requires end-to-end audit logs tracking every inference request.
In addition, access control policies must strictly enforce the principle of least privilege. Role-based access control (RBAC) and attribute-based access control (ABAC) frameworks regulate which services, agents, or end-users can invoke specific pipeline capabilities or access vector database collections.
Observability, Telemetry, and Performance Optimization
Comprehensive observability pipelines are essential for monitoring modern AI deployments. Telemetry metrics such as time-to-first-token (TTFT), token generation throughput, GPU memory utilization, and cost-per-query are continuously aggregated using standardized metrics exporters and distributed tracing platforms.
Performance optimization strategies leverage model quantization, context compression, and continuous batching techniques to minimize latency and maximize hardware efficiency. By continuously profiling resource utilization and analyzing semantic drift across user query distributions, engineering teams maintain peak system efficiency while keeping operational expenses strictly controlled.
Automated Testing, CI/CD, and Model Evaluation
Continuous integration and continuous deployment (CI/CD) pipelines for AI applications must include automated evaluation suites alongside traditional unit and integration tests. Automated regression testing evaluates generated outputs against benchmark datasets, scoring factual correctness, logical coherence, and safety constraint compliance before promoting new code into production.
Shadow deployments and canary release strategies further mitigate operational risk by routing a percentage of live production traffic to candidate model configurations, allowing side-by-side performance comparison under real-world workload conditions.