AgentOps is the discipline of running agentic AI systems the way SREs run production services, with traces, metrics, alerts, and dashboards instead of hope. In this hands-on lab you take a support-ticket triage agent built on Amazon Bedrock Agents and instrument it end to end: trace logging, model-invocation logging into CloudWatch, and a dashboard tracking three numbers that predict agent health: p50/p95 latency, tool-call failure rate, and a hallucination-flag rate you compute yourself.
If you have already read the AgentOps guide, this lab is where the theory becomes a running CloudWatch dashboard you can screenshot and defend in a production review.
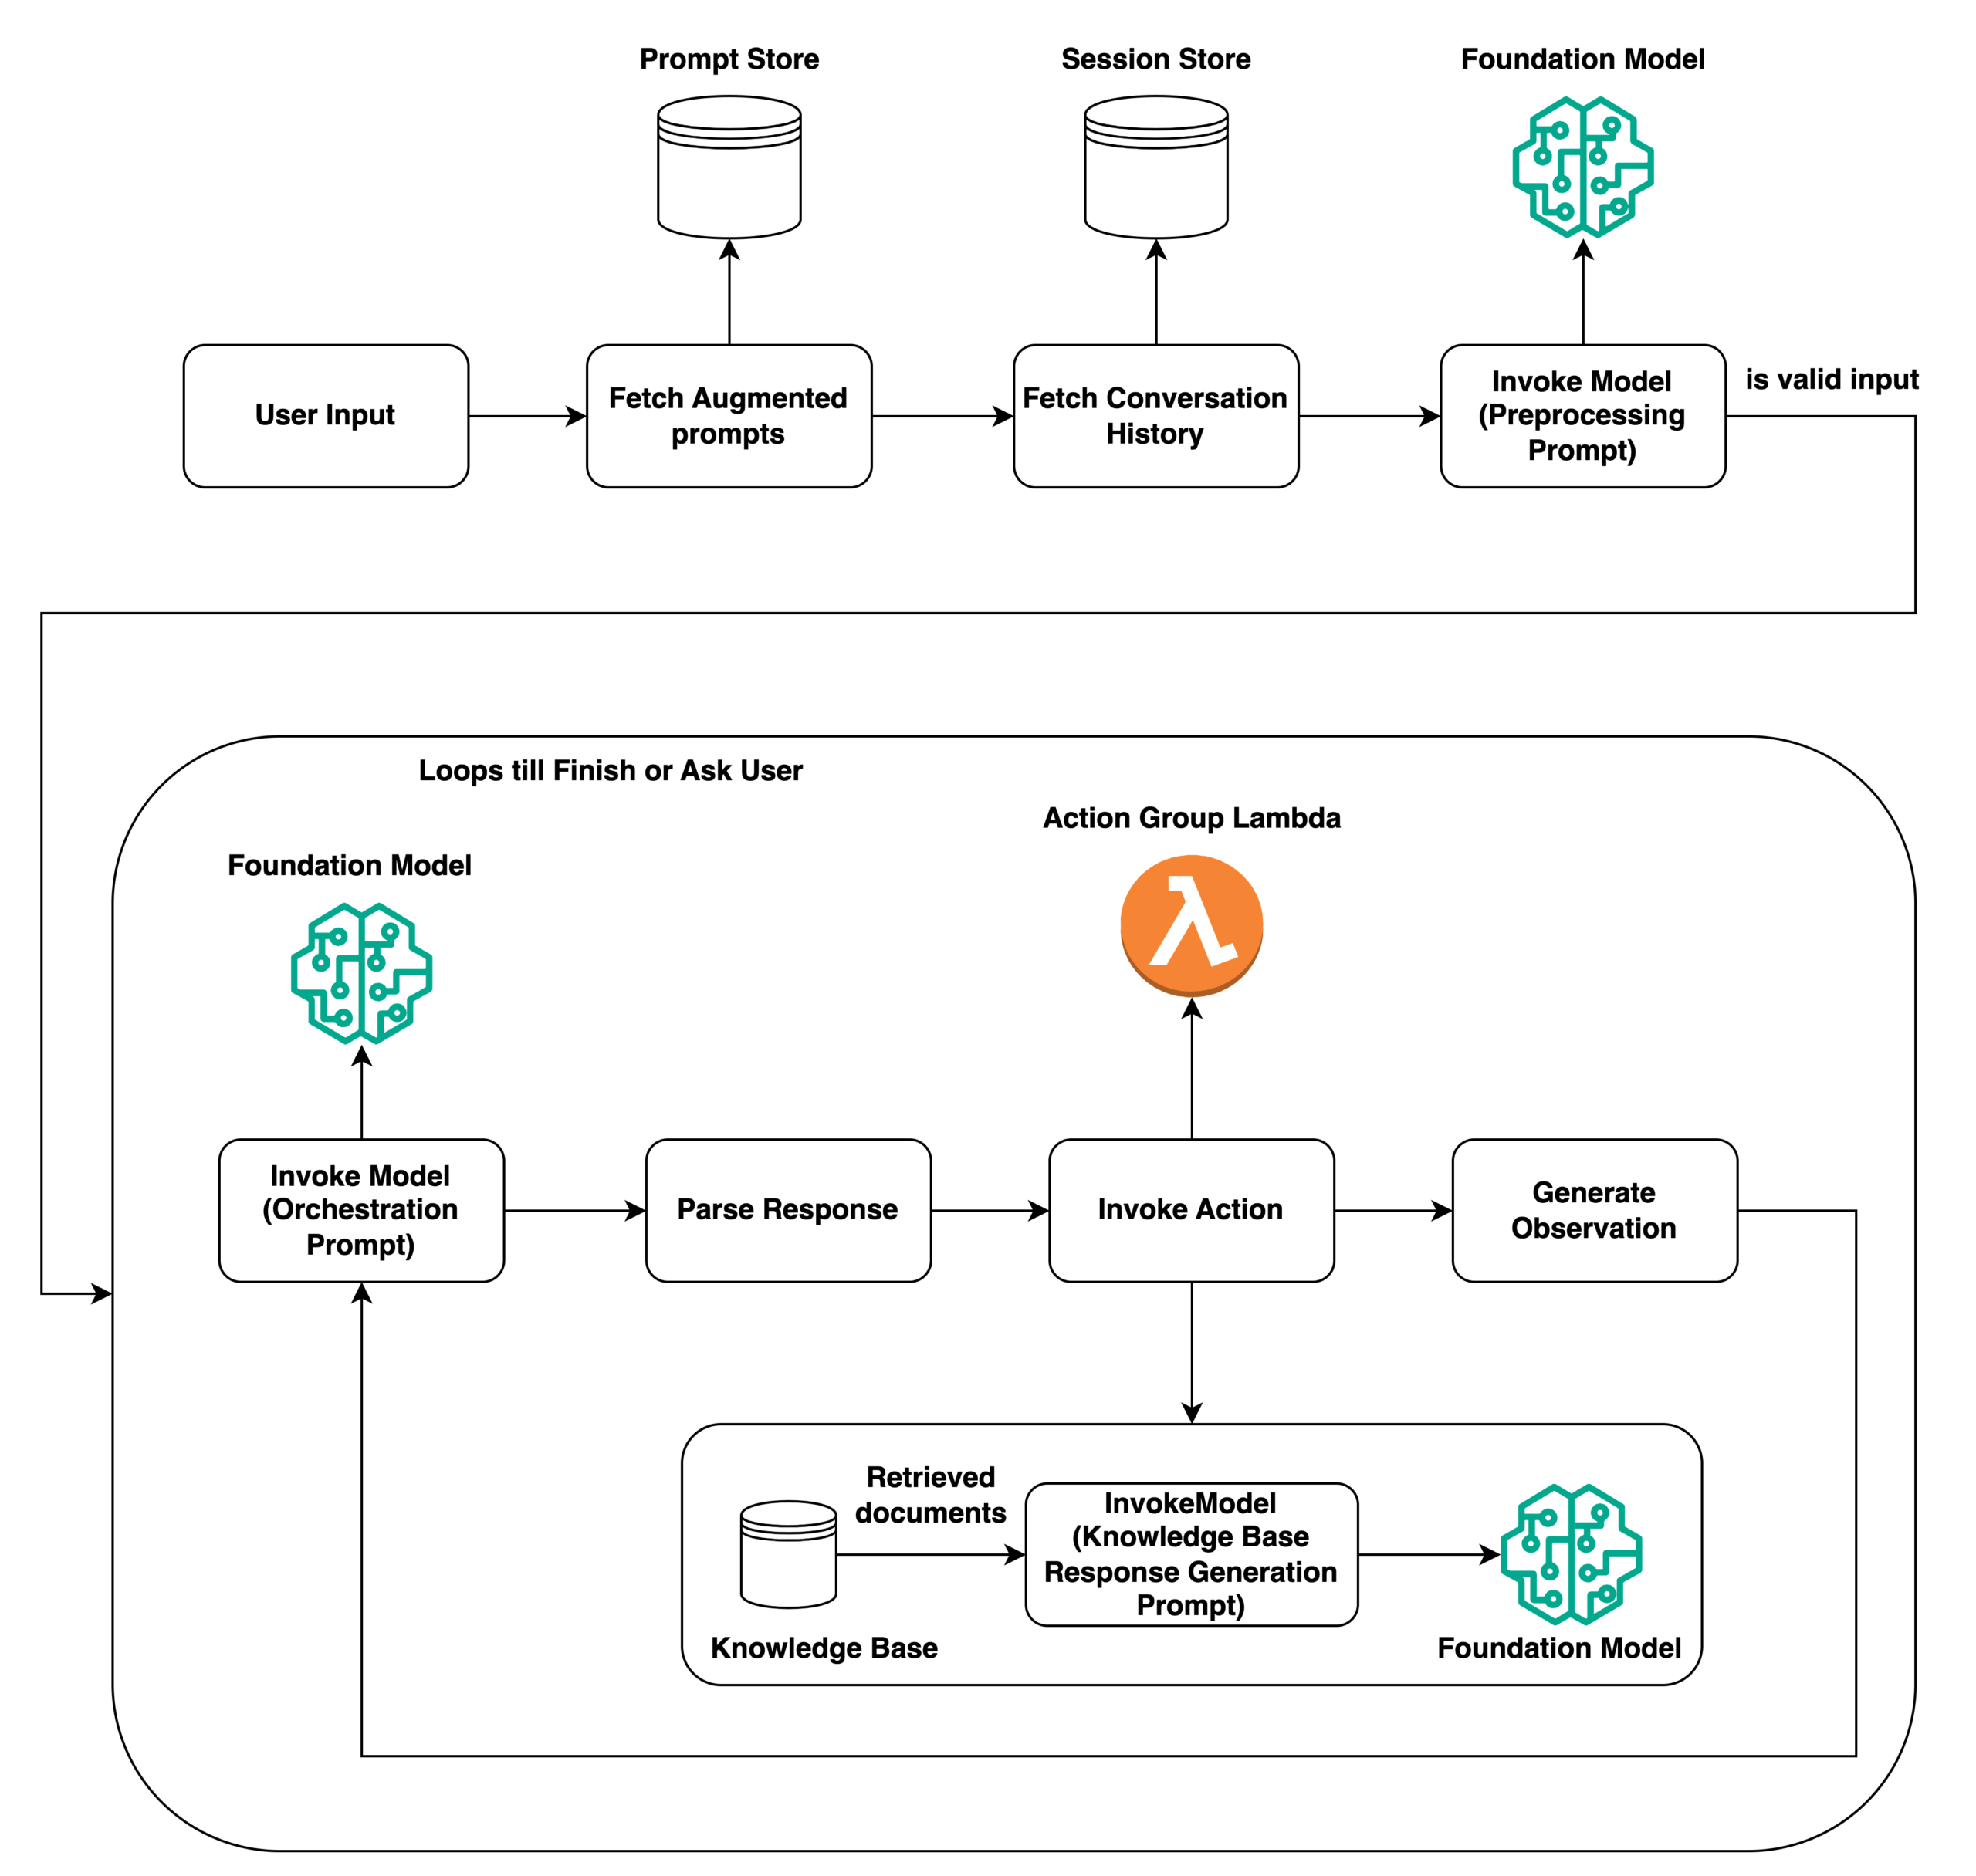
AgentOps: What You’ll Build
By the end you will have a working, observable Bedrock Agent, a support-ticket triage assistant, with three layers of AgentOps instrumentation wired together: agent-level trace logging via the boto3 enableTrace flag, model-invocation logging to a CloudWatch Logs group, and a dashboard built from metric filters and a hallucination-flag heuristic.
You will also write a small Logs Insights query so you can debug a slow or wrong response in under a minute instead of re-reading raw JSON by hand.
This is a practical instrumentation exercise, not a from-scratch agent-building tutorial. We assume you already have (or can quickly stand up) a Bedrock Agent. Prerequisites: an AWS account with Bedrock model access for an Anthropic Claude model, AWS CLI v2 configured with credentials that can create IAM roles and CloudWatch resources, Python 3.11+ with boto3, and roughly 90 minutes.
Scope note: this lab instruments a single agent alias in a single region, enough to prove the pattern end to end. If your organization runs agents across multiple AWS accounts, the same steps apply per account; centralize the CloudWatch dashboards in a monitoring account via cross-account dashboard sharing once one account’s pipeline works.
AgentOps Walkthrough: Instrumenting the Triage Agent
Step 1: Stand up a minimal support-ticket triage agent
If you already have an agent from the AgentOps guide, skip to Step 2 and note its agentId and agentAliasId. If not, create a small one now. The point of this lab is the observability layer, so keep the agent simple: one foundation model, one action group with a single Lambda-backed tool that “looks up” a ticket by ID from an in-memory dictionary.
import boto3
import json

bedrock_agent = boto3.client("bedrock-agent", region_name="us-east-1")

response = bedrock_agent.create_agent(
    agentName="support-triage-agent",
    agentResourceRoleArn="arn:aws:iam::123456789012:role/AmazonBedrockAgentTriageRole",
    foundationModel="anthropic.claude-3-5-sonnet-20241022-v2:0",
    instruction=(
        "You are a support-ticket triage agent. Classify each incoming ticket "
        "into billing, technical, or account-access, assign a severity from 1-5, "
        "and call the lookup_ticket tool to confirm the customer's plan tier "
        "before recommending a routing queue."
    ),
    idleSessionTTLInSeconds=600,
)
agent_id = response["agent"]["agentId"]
print(f"Created agent: {agent_id}")
Building the agent first, even a toy one, means every subsequent step produces real data to look at instead of abstract configuration taken on faith.
Step 2: Prepare the agent and create a working alias
Bedrock Agents separates the DRAFT working copy from a published, aliased version. Trace behavior and logging both attach to specific agent versions. Prepare the DRAFT, then create an alias so you have a stable identifier to invoke and filter CloudWatch queries against.
bedrock_agent.prepare_agent(agentId=agent_id)

waiter_status = "PREPARING"
while waiter_status == "PREPARING":
    import time
    time.sleep(5)
    waiter_status = bedrock_agent.get_agent(agentId=agent_id)["agent"]["agentStatus"]

alias_response = bedrock_agent.create_agent_alias(
    agentId=agent_id,
    agentAliasName="triage-prod",
)
agent_alias_id = alias_response["agentAlias"]["agentAliasId"]
print(f"Alias ready: {agent_alias_id}")
Production incidents almost always trace back to “which version was actually running.” Tagging every log line and metric with agentAliasId from day one lets you compare latency and failure rate between the old alias and a new deploy instead of guessing which one caused a regression.
Step 3: Turn on model invocation logging to CloudWatch Logs
Amazon Bedrock supports account-level model invocation logging, delivered to Amazon S3, CloudWatch Logs, or both. For this lab we want CloudWatch Logs, because that is what lets us build metric filters and Logs Insights queries directly, without a separate ETL step through S3 and Athena. Create the log group first, then point Bedrock’s logging configuration at it.
aws logs create-log-group
  --log-group-name /aws/bedrock/triage-agent/invocations
  --region us-east-1

aws logs put-retention-policy
  --log-group-name /aws/bedrock/triage-agent/invocations
  --retention-in-days 30
bedrock = boto3.client("bedrock", region_name="us-east-1")

bedrock.put_model_invocation_logging_configuration(
    loggingConfig={
        "cloudWatchConfig": {
            "logGroupName": "/aws/bedrock/triage-agent/invocations",
            "roleArn": "arn:aws:iam::123456789012:role/BedrockLoggingDeliveryRole",
        },
        "textDataDeliveryEnabled": True,
        "embeddingDataDeliveryEnabled": False,
        "imageDataDeliveryEnabled": False,
    }
)
print("Model invocation logging enabled")
The roleArn above needs a trust policy that lets the Bedrock service principal assume it, plus a permissions policy granting it write access to the specific log group. Create both before calling put_model_invocation_logging_configuration, or the call succeeds but delivery silently fails.
{
  "Version": "2012-10-17",
  "Statement": [
    {
      "Effect": "Allow",
      "Principal": { "Service": "bedrock.amazonaws.com" },
      "Action": "sts:AssumeRole",
      "Condition": {
        "StringEquals": { "aws:SourceAccount": "123456789012" },
        "ArnLike": { "aws:SourceArn": "arn:aws:bedrock:us-east-1:123456789012:*" }
      }
    }
  ]
}
{
  "Version": "2012-10-17",
  "Statement": [
    {
      "Effect": "Allow",
      "Action": ["logs:CreateLogStream", "logs:PutLogEvents", "logs:CreateLogGroup"],
      "Resource": "arn:aws:logs:us-east-1:123456789012:log-group:/aws/bedrock/triage-agent/invocations:*"
    }
  ]
}
The ArnLike condition on the trust policy matters: without scoping aws:SourceArn to your account’s Bedrock resources, any Bedrock resource in any account that referenced this role’s ARN could theoretically assume it, a classic confused-deputy risk worth closing even in a lab.
Why enable this given that Bedrock Agents already gives you a trace: model invocation logging captures the raw prompt and completion for every underlying foundation-model call, including calls the orchestration layer makes internally that never surface in the agent trace. When a ticket gets misclassified, this is the log you grep. The trace tells you the agent’s reasoning path, the invocation log tells you the literal input/output pair.
Step 4: Capture the agent trace on every invocation
Unlike model invocation logging, which is an account-wide setting, the Bedrock Agents trace is opt-in per call: you request it by setting enableTrace=True on invoke_agent, and the trace events stream back interleaved with the response chunks. Write a thin wrapper that separates the two streams and pushes the trace events into your own CloudWatch Logs group as structured JSON, so they are queryable alongside your invocation logs.
import time
import uuid

agent_runtime = boto3.client("bedrock-agent-runtime", region_name="us-east-1")
logs_client = boto3.client("logs", region_name="us-east-1")

TRACE_LOG_GROUP = "/aws/bedrock/triage-agent/traces"

def invoke_and_log(prompt, session_id=None):
    session_id = session_id or str(uuid.uuid4())
    start = time.time()

    response = agent_runtime.invoke_agent(
        agentId=agent_id,
        agentAliasId=agent_alias_id,
        sessionId=session_id,
        inputText=prompt,
        enableTrace=True,
    )

    completion = ""
    trace_events = []
    tool_call_failures = 0

    for event in response.get("completion"):
        if "chunk" in event:
            completion += event["chunk"]["bytes"].decode()
        if "trace" in event:
            trace = event["trace"]["trace"]
            trace_events.append(trace)
            # Action group invocations that raised an error surface here
            invocation = trace.get("orchestrationTrace", {}).get("invocationInput", {})
            if invocation.get("actionGroupInvocationInput"):
                observation = trace.get("orchestrationTrace", {}).get("observation", {})
                if observation.get("actionGroupInvocationOutput", {}).get("text", "").lower().startswith("error"):
                    tool_call_failures += 1

    latency_ms = round((time.time() - start) * 1000)

    _emit_trace_log(session_id, prompt, completion, trace_events, latency_ms, tool_call_failures)
    return completion, latency_ms, tool_call_failures


def _emit_trace_log(session_id, prompt, completion, trace_events, latency_ms, tool_call_failures):
    record = {
        "sessionId": session_id,
        "agentAliasId": agent_alias_id,
        "prompt": prompt,
        "completion": completion,
        "latencyMs": latency_ms,
        "toolCallFailures": tool_call_failures,
        "traceEventCount": len(trace_events),
        "timestamp": int(time.time() * 1000),
    }
    stream_name = time.strftime("%Y-%m-%d", time.gmtime())
    try:
        logs_client.create_log_stream(logGroupName=TRACE_LOG_GROUP, logStreamName=stream_name)
    except logs_client.exceptions.ResourceAlreadyExistsException:
        pass
    logs_client.put_log_events(
        logGroupName=TRACE_LOG_GROUP,
        logStreamName=stream_name,
        logEvents=[{"timestamp": record["timestamp"], "message": json.dumps(record)}],
    )
Raw Bedrock trace objects are deeply nested and vary in shape between orchestration, pre-processing, and post-processing steps. Parsing that structure directly in a metric filter breaks every time agent behavior changes subtly. Instead, extract the three numbers you actually care about (latency, tool-call failure, trace event count) into one flat JSON record per invocation, and log the raw trace only when you need to debug a specific session.
Step 5: Build a hallucination-flag heuristic
There is no built-in “hallucination detected” field in Bedrock’s trace or invocation logs. You have to define what a hallucination flag means for your use case and compute it yourself. For a ticket-triage agent, a reasonable heuristic is: the agent claimed to have looked up the customer’s plan tier via the tool,
but the tool was never actually invoked in this session’s trace (the model asserted a “confirmed” plan tier from nowhere), or the tool was invoked but the model’s stated tier does not match the tool’s returned value.
import re

def check_hallucination_flag(trace_events, completion_text):
    tool_was_called = any(
        t.get("orchestrationTrace", {}).get("invocationInput", {}).get("actionGroupInvocationInput")
        for t in trace_events
    )
    claims_confirmation = bool(
        re.search(r"bconfirm(ed)?b.*bplanb|bplan tierb.*bconfirm", completion_text, re.IGNORECASE)
    )
    if claims_confirmation and not tool_was_called:
        return True  # model claimed a lookup it never performed

    tool_output_tier = None
    for t in trace_events:
        obs = t.get("orchestrationTrace", {}).get("observation", {}).get("actionGroupInvocationOutput", {})
        if obs.get("text"):
            match = re.search(r'"tier":s*"(w+)"', obs["text"])
            if match:
                tool_output_tier = match.group(1).lower()

    stated_tier_match = re.search(r"b(free|pro|enterprise)b", completion_text, re.IGNORECASE)
    if tool_output_tier and stated_tier_match:
        if stated_tier_match.group(1).lower() != tool_output_tier:
            return True  # model contradicted the tool's actual answer

    return False
Bedrock does not expose a generic hallucination-detection score for agent responses. Bedrock Guardrails’ contextual grounding check is the closest managed primitive, and it applies to RAG-style grounding against source documents, not free-form tool-call consistency. For an agent whose job is to relay a tool’s output faithfully, a targeted consistency check like this one catches the exact failure mode that matters: the agent inventing a fact it should have retrieved.
Step 6: Emit a custom CloudWatch metric per invocation
Logs are for debugging one session; metrics are for seeing trends across thousands of sessions on a dashboard. Push the three signals (latency, tool-call failure, hallucination flag) as a CloudWatch custom metric using put_metric_data, namespaced so they do not collide with any other application’s metrics.
cloudwatch = boto3.client("cloudwatch", region_name="us-east-1")

def emit_metrics(latency_ms, tool_call_failures, hallucination_flag):
    cloudwatch.put_metric_data(
        Namespace="TriageAgent/AgentOps",
        MetricData=[
            {
                "MetricName": "InvocationLatencyMs",
                "Value": latency_ms,
                "Unit": "Milliseconds",
                "Dimensions": [{"Name": "AgentAlias", "Value": agent_alias_id}],
            },
            {
                "MetricName": "ToolCallFailures",
                "Value": tool_call_failures,
                "Unit": "Count",
                "Dimensions": [{"Name": "AgentAlias", "Value": agent_alias_id}],
            },
            {
                "MetricName": "HallucinationFlag",
                "Value": 1 if hallucination_flag else 0,
                "Unit": "Count",
                "Dimensions": [{"Name": "AgentAlias", "Value": agent_alias_id}],
            },
        ],
    )
CloudWatch’s built-in Bedrock metrics live in the AWS/Bedrock namespace and describe the foundation model, not your agent’s business logic. Your triage-specific signals only exist in your application, so they belong in your own namespace, and dimensioning by alias lets you filter the dashboard to a single version when validating a new deploy.
Step 7: Wire it together and generate sample traffic
With logging and metrics in place, run a batch of representative ticket prompts through the agent so your dashboard has real data to render. Vary the prompts deliberately. Include a few that should trigger a genuine tool-call failure (a nonexistent ticket ID) so you can confirm the failure metric actually fires.
sample_tickets = [
    "Ticket #4471: customer can't log in, says password reset email never arrived.",
    "Ticket #4472: customer disputing a duplicate charge on their invoice.",
    "Ticket #4473: customer on the enterprise plan reports API returning 500s.",
    "Ticket #9999: this ticket ID does not exist, please look it up anyway.",
    "Ticket #4474: customer asks to confirm their plan tier before upgrading.",
]

for prompt in sample_tickets:
    completion, latency_ms, tool_call_failures = invoke_and_log(prompt)
    print(f"latency={latency_ms}ms failures={tool_call_failures}")
    print(completion[:200], "n---")
A dashboard that has only seen happy-path traffic tells you nothing about whether your failure metric works. A ticket ID you know does not exist gives you a guaranteed non-zero data point to verify against.
Step 8: Create metric filters for structured log fields
In addition to the custom metrics you push explicitly, add a CloudWatch Logs metric filter on the trace log group so you have a second, independent way to derive the same signals directly from the raw logs, useful as a sanity check, and useful for historical backfill if you ever add a new metric after the fact.
aws logs put-metric-filter
  --log-group-name /aws/bedrock/triage-agent/traces
  --filter-name HighLatencyInvocations
  --filter-pattern '{ $.latencyMs > 4000 }'
  --metric-transformations
      metricName=HighLatencyInvocationCount,metricNamespace=TriageAgent/AgentOps,metricValue=1,defaultValue=0
The push-based metric is precise but depends on your application code running correctly. A metric filter reads the log group directly, so if put_metric_data silently stops firing, the log-derived count still shows invocations happening. The discrepancy between the two is itself a useful signal something broke.
Step 9: Build the CloudWatch dashboard
Assemble the three signals into a single CloudWatch dashboard with three widgets: a latency percentile graph (p50/p95), a tool-call failure rate graph, and a hallucination-flag rate graph, all sharing the same time axis so you can correlate spikes visually.
dashboard_body = {
    "widgets": [
        {
            "type": "metric",
            "x": 0, "y": 0, "width": 12, "height": 6,
            "properties": {
                "title": "Invocation Latency (p50 / p95)",
                "metrics": [
                    ["TriageAgent/AgentOps", "InvocationLatencyMs", "AgentAlias", agent_alias_id, {"stat": "p50", "label": "p50"}],
                    ["TriageAgent/AgentOps", "InvocationLatencyMs", "AgentAlias", agent_alias_id, {"stat": "p95", "label": "p95"}],
                ],
                "period": 300,
                "region": "us-east-1",
            },
        },
        {
            "type": "metric",
            "x": 12, "y": 0, "width": 12, "height": 6,
            "properties": {
                "title": "Tool-Call Failure Count",
                "metrics": [
                    ["TriageAgent/AgentOps", "ToolCallFailures", "AgentAlias", agent_alias_id, {"stat": "Sum"}],
                ],
                "period": 300,
                "region": "us-east-1",
            },
        },
        {
            "type": "metric",
            "x": 0, "y": 6, "width": 12, "height": 6,
            "properties": {
                "title": "Hallucination Flag Rate",
                "metrics": [
                    ["TriageAgent/AgentOps", "HallucinationFlag", "AgentAlias", agent_alias_id, {"stat": "Sum"}],
                ],
                "period": 300,
                "region": "us-east-1",
            },
        },
    ]
}

cloudwatch.put_dashboard(
    DashboardName="TriageAgent-AgentOps",
    DashboardBody=json.dumps(dashboard_body),
)
print("Dashboard published: TriageAgent-AgentOps")
Each widget catches a different failure mode: latency catches infrastructure problems, tool-call failures catch integration bugs, and the hallucination flag catches reasoning problems infrastructure monitoring would never surface. One shared time axis lets you answer what matters during an incident: did the model get slower, did a tool break, or did the model start making things up.
Step 10: Query a specific session with Logs Insights
When the dashboard shows a spike, you need to go from “the hallucination-flag rate went up at 14:32 UTC” to “here is the exact session and prompt that caused it.” CloudWatch Logs Insights is the tool for that jump.
aws logs start-query
  --log-group-name /aws/bedrock/triage-agent/traces
  --start-time $(date -d '1 hour ago' +%s)
  --end-time $(date +%s)
  --query-string 'fields sessionId, prompt, completion, latencyMs, toolCallFailures | filter toolCallFailures > 0 | sort latencyMs desc | limit 20'
The flat record shape from Step 4 makes this query trivial: filter toolCallFailures > 0 works directly against a top-level field. Instrumentation that is easy to query is instrumentation people actually use during an incident.
Step 11: Add a CloudWatch Alarm so the dashboard pages someone
A dashboard is only useful if someone is looking at it, so close the loop with an alarm on the metric most likely to correlate with a real customer-facing problem: sustained tool-call failures. Route it to an SNS topic; wiring that topic to your paging tool of choice is a one-time setup outside the scope of this lab.
aws sns create-topic --name triage-agent-agentops-alerts

aws cloudwatch put-metric-alarm
  --alarm-name TriageAgent-ToolCallFailures-High
  --namespace TriageAgent/AgentOps
  --metric-name ToolCallFailures
  --dimensions Name=AgentAlias,Value=$AGENT_ALIAS_ID
  --statistic Sum
  --period 300
  --evaluation-periods 1
  --threshold 5
  --comparison-operator GreaterThanThreshold
  --alarm-actions arn:aws:sns:us-east-1:123456789012:triage-agent-agentops-alerts
  --treat-missing-data notBreaching
If the triage agent legitimately has quiet periods, a naive alarm can flip to INSUFFICIENT_DATA or alarm state simply because no data points arrived, a false page for an idle, not broken, system. --treat-missing-data notBreaching avoids paging your team over silence.
Step 12: Validate the pipeline end to end before calling it done
Before you trust this instrumentation for a real incident, run through a short validation checklist. This is the step teams skip under time pressure, and it is exactly the step that determines whether your dashboard tells the truth six months from now.
- Confirm the CloudWatch Logs group
/aws/bedrock/triage-agent/invocationshas recent log streams with actual invocation bodies, not just empty streams. An empty stream usually means the IAM role from Step 3 is missing a permission. - Confirm the trace log group
/aws/bedrock/triage-agent/tracesshows one record per invocation from Step 7’s sample traffic, withtoolCallFailuresgreater than zero on the ticket #9999 prompt specifically. - Open the
TriageAgent-AgentOpsdashboard from Step 9 and confirm all three widgets render data points, not “no data” placeholders. A blank widget almost always means a namespace or dimension mismatch between what Step 6 pushes and what Step 9’s dashboard body queries. - Manually trigger the alarm from Step 11 by sending several deliberately broken prompts in quick succession, and confirm the SNS topic actually receives a notification. An alarm that has never fired even once in a test is an alarm you cannot trust in production.
Instrumentation pipelines fail silently far more often than they fail loudly. A missing IAM permission does not throw an exception, it just leaves the log group empty while everything else appears to work. The only way to catch that is to go and look, deliberately, before you need the data during a real incident.
AgentOps: Common Mistakes to Avoid
Even teams that take observability seriously trip over the same handful of issues when wiring up AgentOps for a Bedrock Agent.
- Enabling model invocation logging but never enabling agent trace. Invocation logging shows you individual model calls; without
enableTrace=Trueoninvoke_agent, you lose the orchestration path connecting those calls to a single user session, so you can see that a model call happened but not why the agent made it. - Forgetting to dimension metrics by agent alias. Without an
AgentAliasdimension, you cannot separate a new deploy’s metrics from the previous version’s, which means you cannot tell whether a change you shipped improved or regressed latency and failure rate. - Treating tool-call errors and hallucinations as the same failure mode. A tool-call failure means the action group itself errored; a hallucination flag means the tool worked fine but the model misreported its result. Collapsing these into one metric hides which layer of the stack actually needs fixing.
- Not testing the failure path before trusting the dashboard. If you only ever send happy-path prompts through the agent while setting this up, you will not discover that your tool-call-failure detection logic has a bug until a real incident depends on it.
AgentOps: Going Further with Production Hardening
For the authoritative reference on this topic, see Amazon Bedrock model invocation logging documentation.
The lab above gets you a working dashboard, but a production-grade AgentOps setup needs a few more layers before it can be trusted to page someone at 3 a.m.
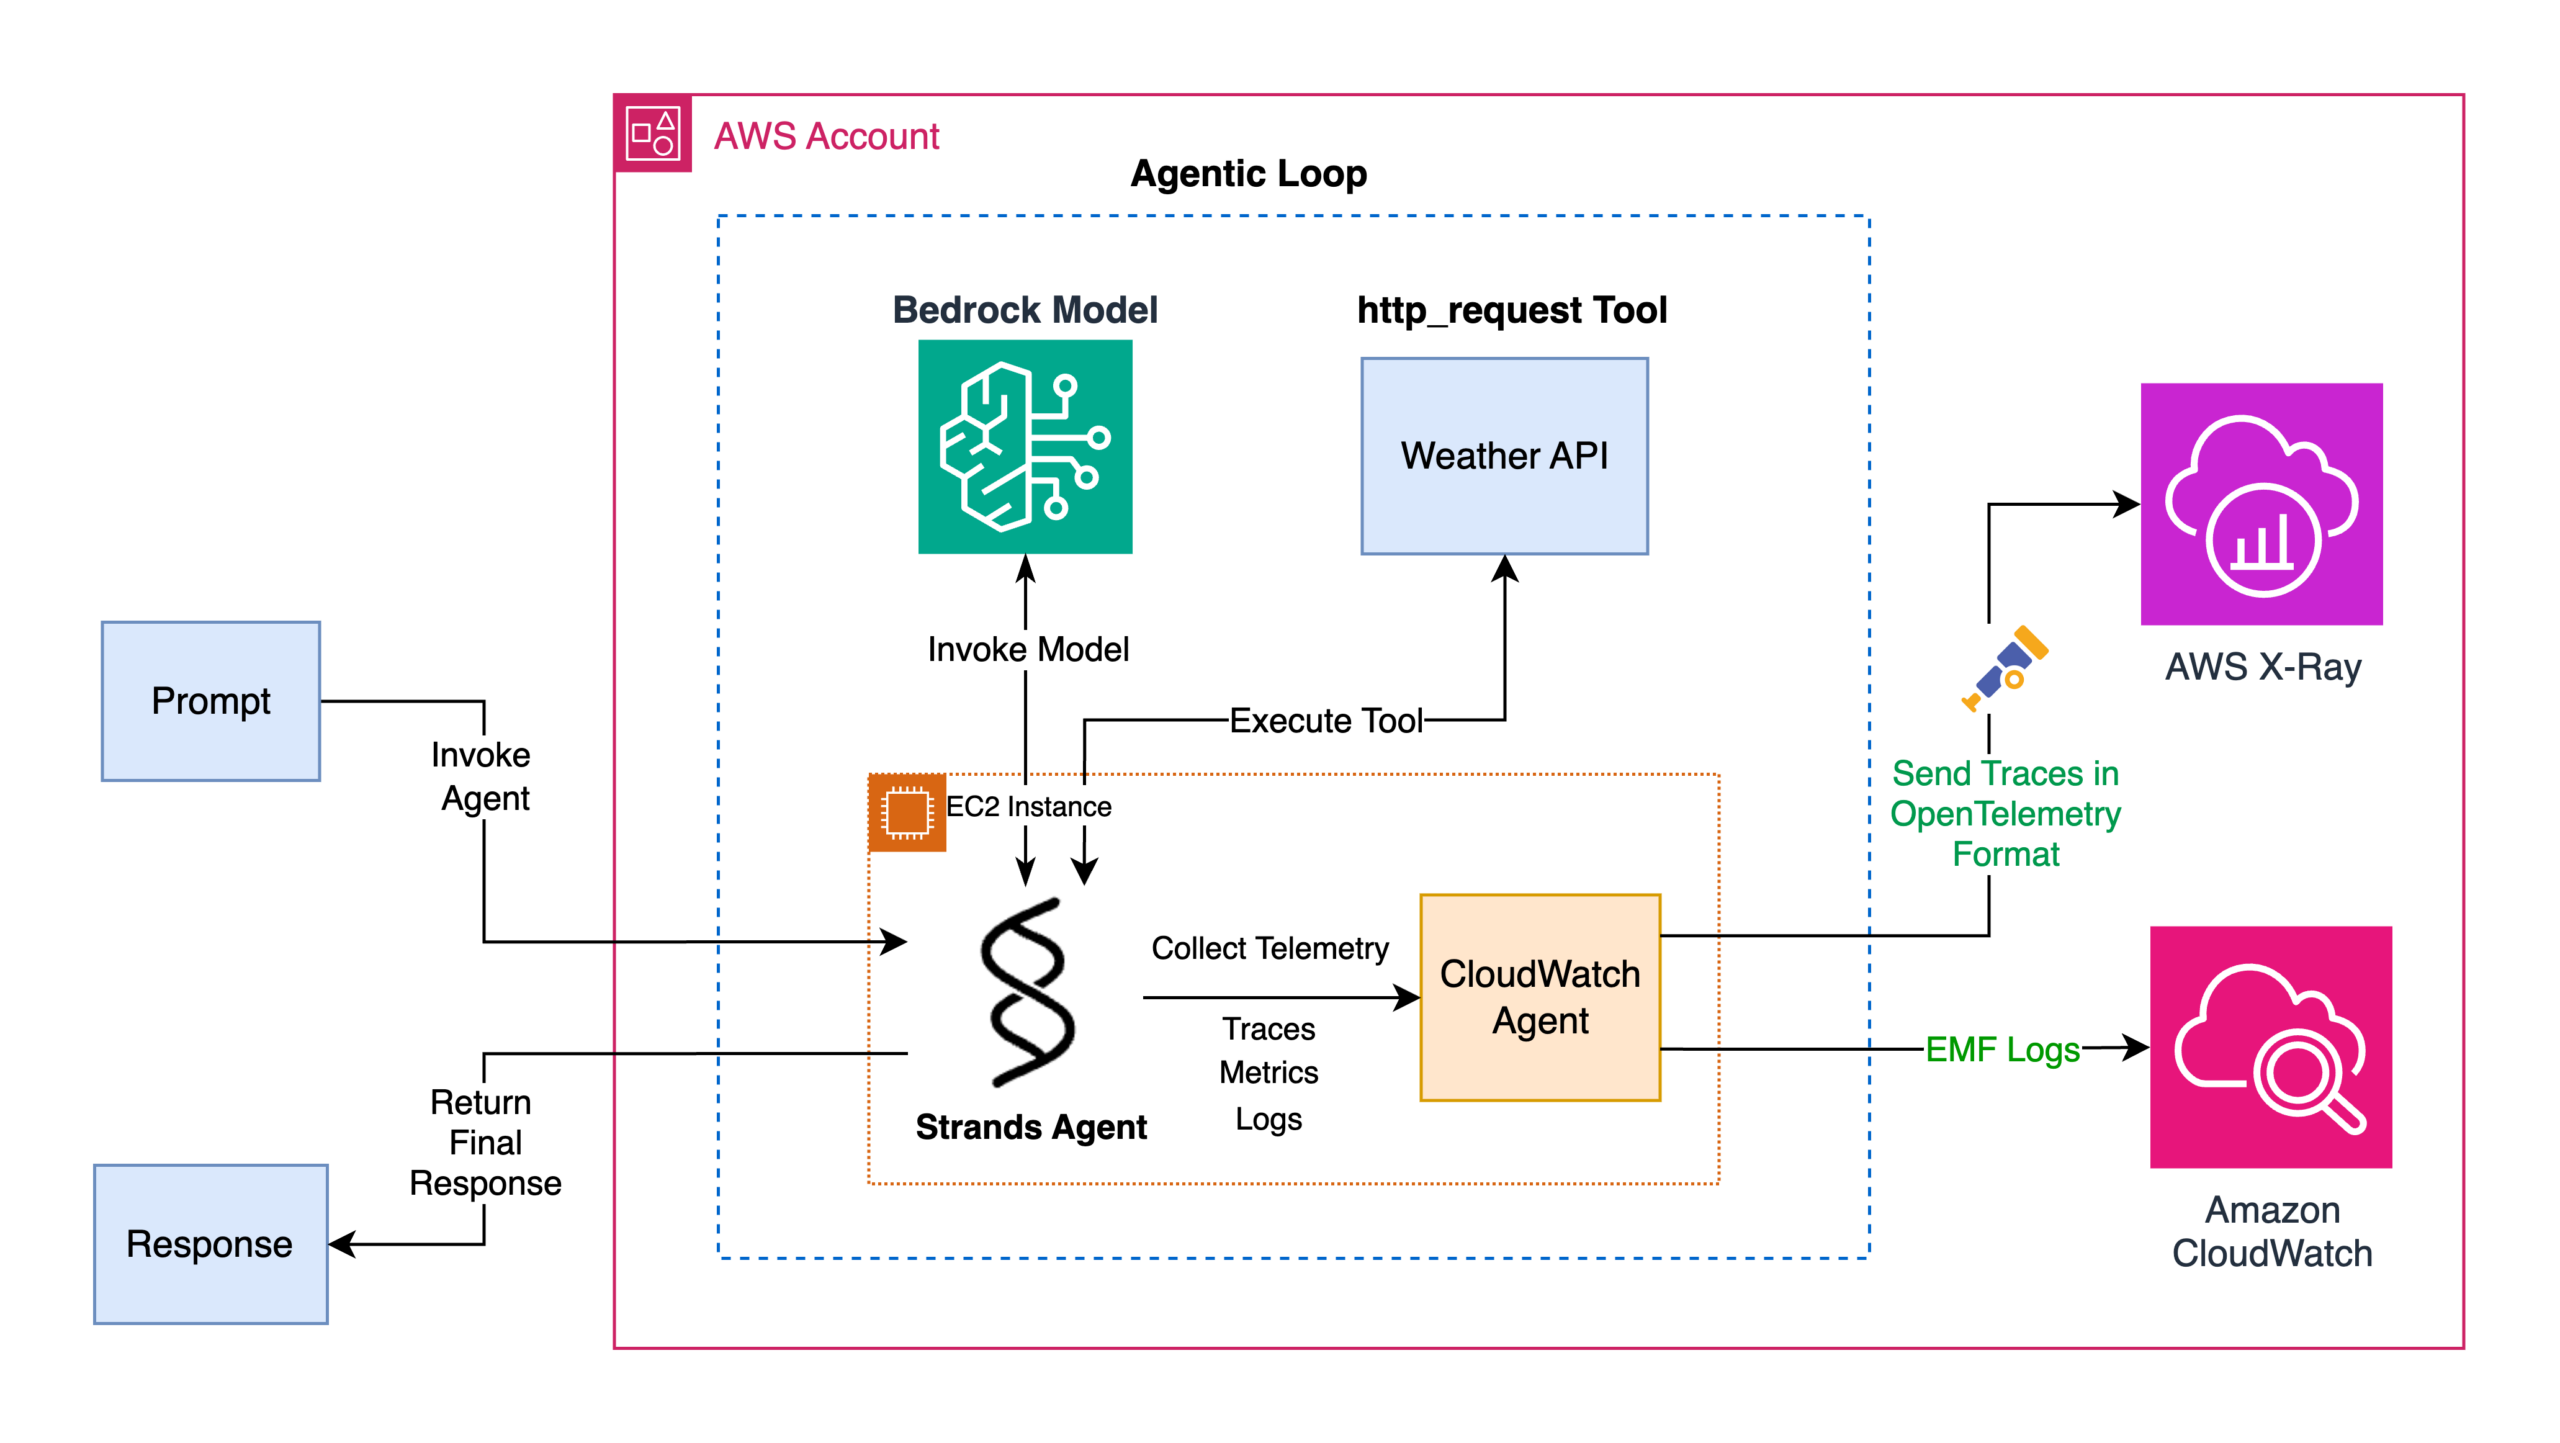
The most important next step is moving from custom metrics you push manually to Amazon Bedrock AgentCore Observability, a managed layer built for agentic workloads. It captures the full execution path of each invocation via OpenTelemetry-compatible telemetry, powered by CloudWatch, giving you dashboards for traces, session count, latency, duration, token usage, and error rates without hand-rolling the metric-emission code from Steps 6-9.
Second is alerting: a dashboard nobody looks at until something breaks is a historical record, not observability. Add CloudWatch Alarms on the three metrics: p95 latency crossing an SLA threshold, tool-call failures crossing a handful in a five-minute window, and hallucination-flag rate crossing a percentage of invocations, since one flag is a data point but a sustained rate is an incident.
Route all three alarms to an SNS topic that fans out to your paging tool, with the alarm description linking straight back to the dashboard.
Third is cost. Trace logging and model invocation logging both write substantial log volume. For a busy triage agent, unfiltered text logging of every prompt and completion can become a large line item. Use textDataDeliveryEnabled deliberately: once validated, route bulk invocation logs to S3 (cheaper for data queried occasionally via Athena) while keeping CloudWatch Logs for the high-value trace-summary records from Step 4.
Apply the Step 3 retention policy across every log group. Thirty days is a reasonable default, with a long-term S3 export for audit-grade history.
Finally, handle errors around the instrumentation code itself. The Step 4 wrapper calls put_log_events and put_metric_data synchronously in the same code path as the agent invocation. Wrap those calls in a try/except that logs a local warning and continues, so an observability outage never becomes a customer-facing outage.
AgentOps: Frequently Asked Questions
These questions come up once a team moves this lab’s pattern into a shared production environment, where getting AgentOps wrong costs more than a broken dashboard on a laptop.
Do I need Amazon Bedrock AgentCore to do AgentOps, or is the manual CloudWatch approach in this lab enough?
The manual approach in this lab is a legitimate production pattern and is what many teams start with. AgentCore Observability is the managed evolution of the same idea: same CloudWatch backbone, but with OpenTelemetry-standard traces and less custom code to maintain. Start manual, migrate when the bespoke pipeline becomes a maintenance burden.
How much does this observability setup cost to run in production?
Costs come from three places: CloudWatch Logs ingestion and storage for trace and invocation logs, CloudWatch custom metrics (billed per metric per month), and the underlying model invocations themselves. For a moderate-volume triage agent,
the logging and metrics layer typically adds a small single-digit percentage on top of the model inference cost. The S3-routing and retention advice in the Going Further section is how you keep that percentage from growing unchecked as volume scales.
What is the difference between the agent trace and CloudWatch’s built-in Bedrock metrics?
CloudWatch’s built-in AWS/Bedrock namespace metrics (invocation count, throttles, model-level latency) describe the foundation model layer and require no setup. The agent trace, opt-in via enableTrace, describes the orchestration layer: which action groups were called, what the model reasoned between steps, and what each tool returned. You need both: the built-in metrics tell you the model is healthy, the trace tells you the agent’s decisions are correct.
Why did my metric filter from Step 8 return zero results even after running sample traffic?
The most common cause is a mismatch between the filter pattern and the actual JSON field name or type. CloudWatch Logs metric filters on JSON require the field to appear exactly as referenced (case-sensitive) and the log event to be valid single-line JSON. Double-check the flat record shape from Step 4 matches the filter pattern in Step 8 field for field before assuming the metric pipeline itself is broken.
What happens if I forget to call prepare_agent after changing the agent’s instruction?
The DRAFT version stores your change, but the alias you invoke keeps serving the previously prepared version until you call prepare_agent again and the alias is updated to point at the new prepared version. This is a common source of “why isn’t my instrumentation showing the new behavior” confusion. Always re-prepare and confirm the alias’s routing configuration after any agent change.
AgentOps is what turns a black-box agent into an operable production system: this lab wired trace logging, CloudWatch model-invocation logging, and a hallucination-flag heuristic into one dashboard tracking latency, tool-call failures, and hallucination rate. Keep the flat summary-record pattern and a sane retention policy, and treat this manual AgentOps pipeline as the baseline you run as-is or evolve into AgentCore Observability once volume justifies it.